Hello Friends,
In today's lecture, we will go and find Descriptive statistics by e-views. now a question arises why would we require descriptive statistics.here are a few reasons.
In today's lecture, we will go and find Descriptive statistics by e-views. now a question arises why would we require descriptive statistics.here are a few reasons.
- It enables us to present the data in a more meaningful way, which allows a simpler interpretation of the data.
- The main purpose of descriptive statistics is to provide a brief summary of the samples and the measures done on a particular study.
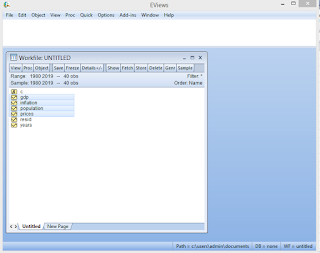
now open e-views and import data from the excel sheet. so finally you would be here.
then open the complete data table by pressing enter key (after selecting variables)
now select Views from the menu bar
from view we have to select the "Descriptive Stats" option and then "Common Sample" and here we have the result window and it would be like that.
-------------------------------------------------------------------------------------------------------------------------- Interpretation of Descriptive Stats
Suppose ve have Results like that. then
Description
|
GDP
|
Inflation
|
Population
|
Price
|
Mean
|
4.005952
|
5.410366
|
3358333.
|
176.2366
|
Median
|
4.232143
|
5.805868
|
3358333.
|
176.2366
|
Maximum
|
5.200000
|
8.440000
|
5503333.
|
340.6911
|
Minimum
|
1.800000
|
1.200000
|
1200000.
|
10.00000
|
Stad. Deviation
|
0.829710
|
2.070294
|
1285960.
|
98.75186
|
Variance
|
0.672400
|
4.286117
|
----
|
9751.5625
|
Skewness
|
-1.007070
|
-0.441171
|
-9.12E-05
|
-0.012148
|
Kurtosis
|
3.144214
|
2.104262
|
1.798769
|
1.818367
|
here we have mean of
GDP, Inflation, Population, and Prices which explains the average of the data.
Whereas Median explains the central value of the data. Maximum and minimum
value expresses the range 0f data. Now moving towards the standard deviation we
got how much data deviate from its central point. In our data, we can see that
skewness is normal and positive for every four variables. When we talked about Kurtosis it must be below 3. GDP has 3.14>3 so we
can say that GDP is positively skewed with slight leptokurtic shape. Reaming
variables (Inflation, Population, and Price) are less than 3 Kurtosis as well as
positively skewed and have Masokartic shape.


No comments:
Post a Comment